08 — Analytics
written by Brent on January 03, 2021An important aspect in managing your blog is to know what's going on. Being able to analyse which posts are popular and which are not, where your audience is coming from, etc. is an invaluable asset if you want your blog to grow. It's only by having insights into your visitors' behaviour that your blog will truly flourish.
You can choose whatever form of analytics or tracking tools you want. I personally use Google Analytics since there simply isn't any better free alternative out there. So everything I write here will be with GA in mind, but you can apply the same techniques to other tools as well.
First things first: I don't use Google Analytics directly. I use Google Data Studio which can access data from GA. Data Studio gives you a blank canvas to work with. It's an easy-to-use (and free) chart builder. I prefer Data Studio because it allows you to build the charts that actually matter to you on a single page, instead of having to click around in GA.
Here's what part of my Data Studio dashboard looks like:
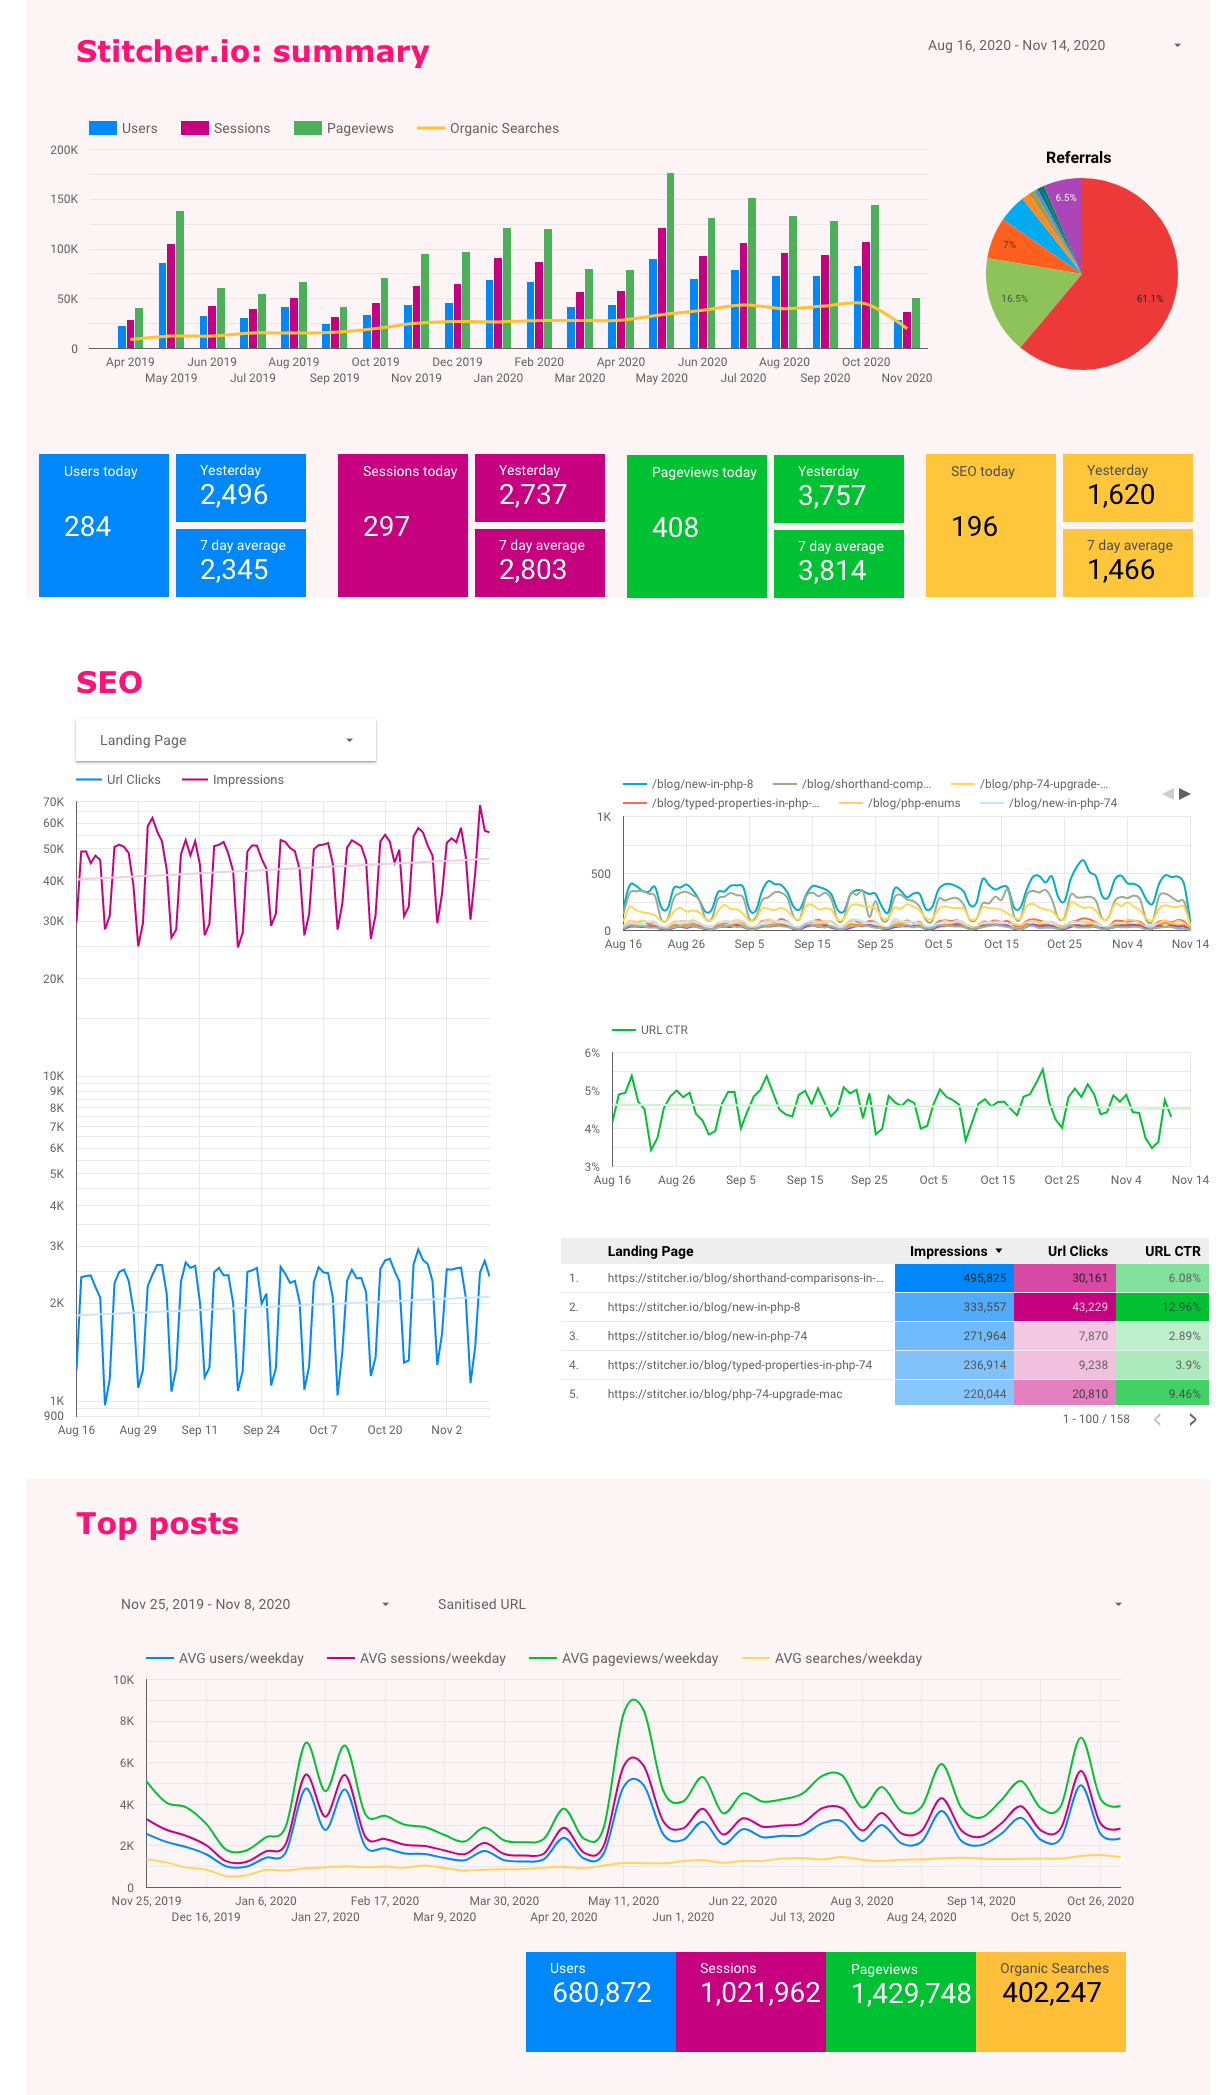 My Data Studio dashboard
You definitely don't have to start with Data Studio though. It's an amazing tool if you want specific questions to be answered with graphs, but starting with GA is often the best idea if you don't have any specific questions yet.
# Analytics
While it's nice to see how many people visited your blog over the course of the previous month, it's a metric that isn't very actionable. Sure: the goal is to have your blog grow, but simply looking at a graph that shows the amount of visitors won't help with that. Still I understand that you want to know if and how your blog is growing. Here's how I visualize blog growth in Data Studio:
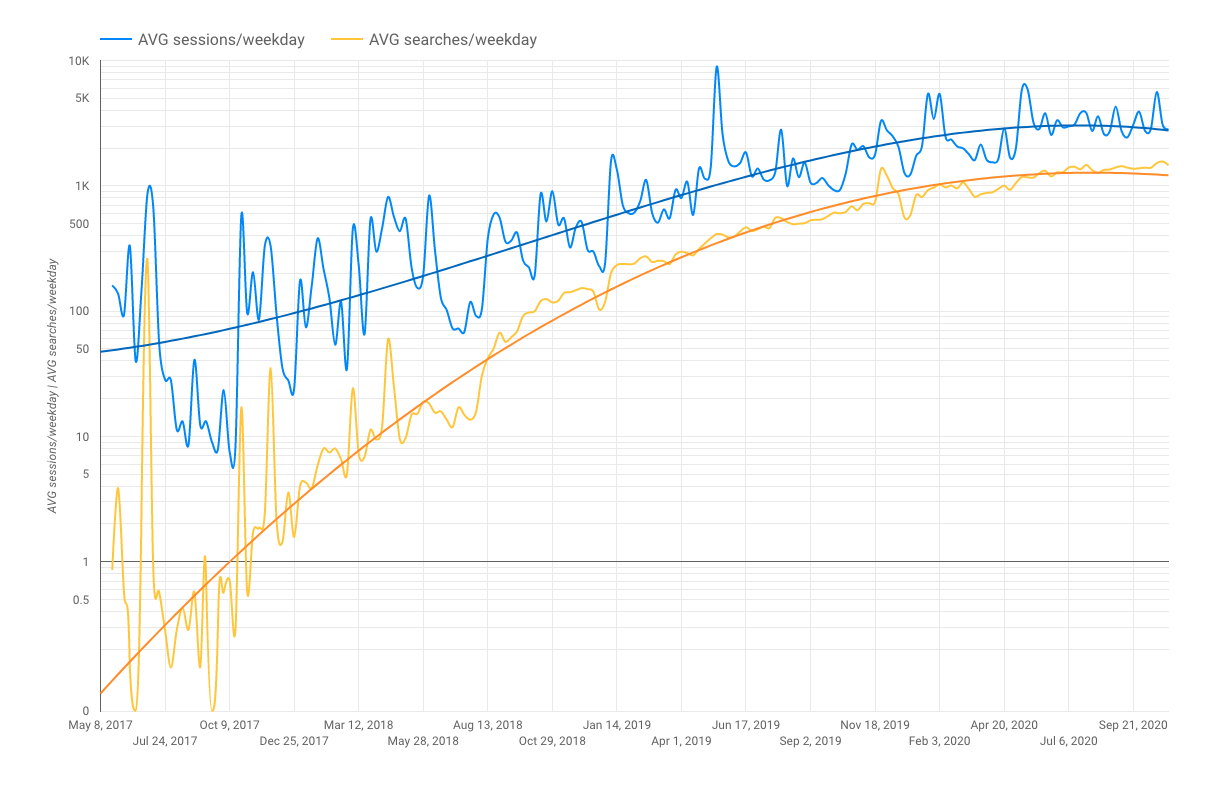 Growth of my blog with logarithmic scale
This chart might seem complex, so let's go through it step by step:
- It shows both sessions and organic searches, I like to see how they related to each other.
- I use a logarithmic scale for this chart. Such a scale is especially useful to visualize exponential growth.
- Instead of showing sessions and searches per day or per month, I use the daily average for each week. This means that extreme lows like weekends or extreme highs like a viral post won't affect the curve as much.
- Finally, I show a polynomial trend line which is the one I'd like to see go up as steep as possible.
It might seem like my blog's growth has reached a plateau over the past year. That's not entirely true though: it's stopped growing at the same rate it did before, but it is still growing. Here's the same graph without the logarithmic scale, which shows what I mean:
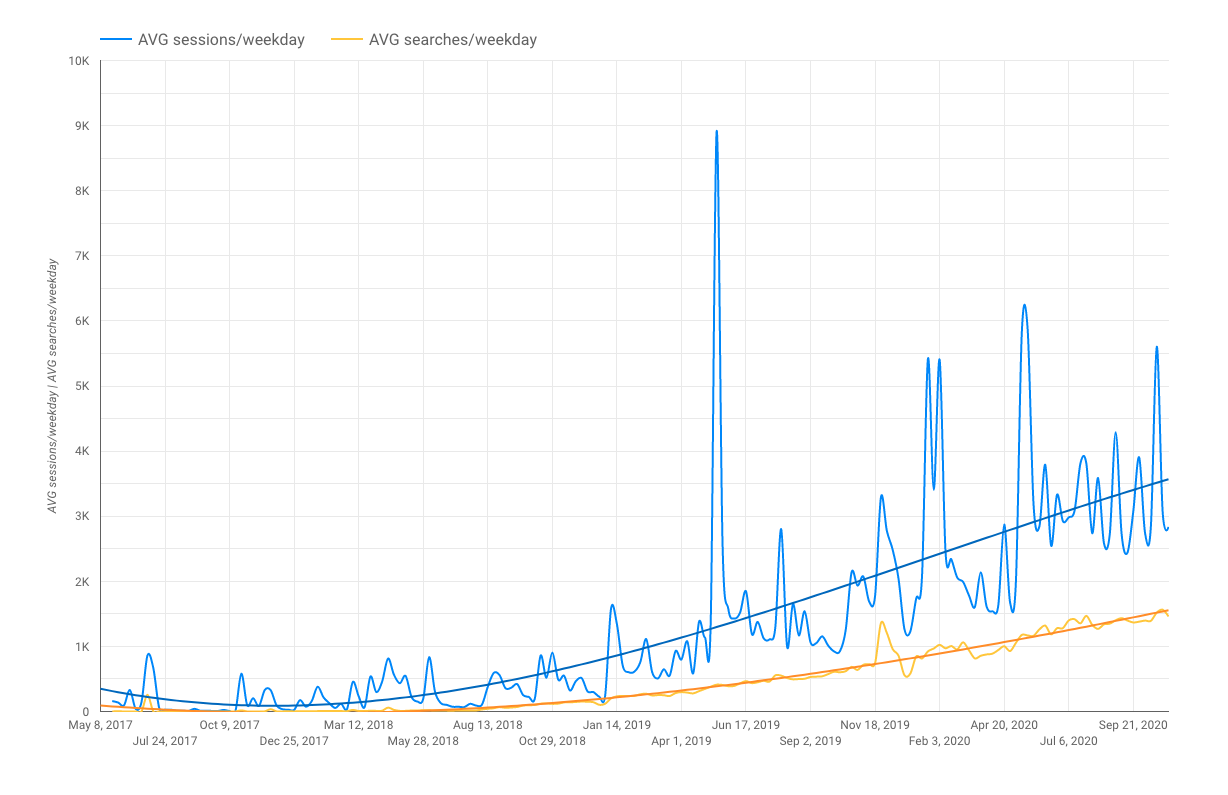 Growth of my blog without logarithmic scale
That brings me to an important piece of advice: you can make charts tell whatever you want, don't fool yourself by doing this! The reason I prefer the logarithmic scale is that it reminds me to stay humble and encourages me to further improve. It leaves me unsatisfied, which is a great incentive to keep writing and growing.
So let's discuss my top five favourite metrics to visualize how my blog is doing.
Do you like what you read?
There's more to come! Make sure to leave your email address to stay up to date of new chapters being added to this series.
# Growth
This is a chart I showed previously: it shows the growth of my blog over its whole lifespan. This chart doesn't give me anything actionable right now, but it is a great way to visualize my blog's performance in the long run.
Growth of my blog with logarithmic scale
# SEO performance and CTR
This one is very actionable: which posts are doing the best in Google, and what's the average click-through rate. These graphs give me insights on whether there might a post that's higher than mine, whether there's room for SEO improvements like better titles, meta descriptions, etc. or maybe there's room for better internal linking.
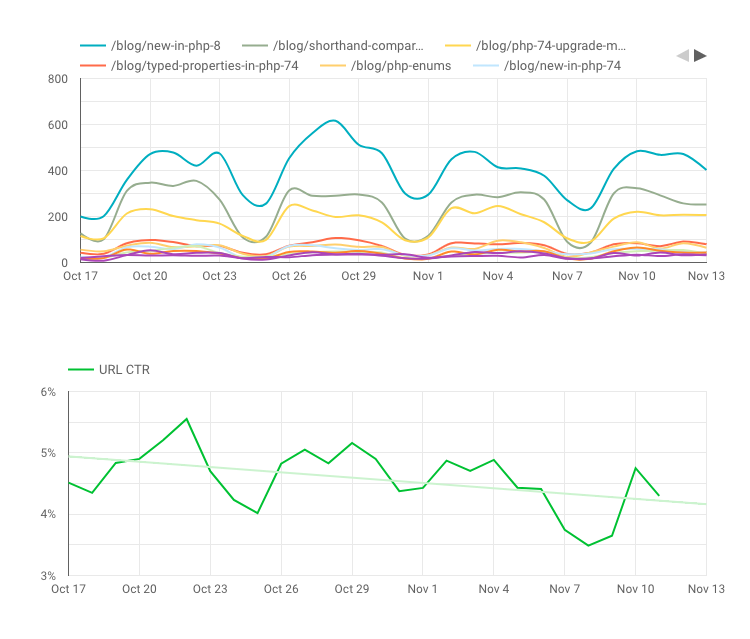 Top performing SEO posts and CTR
Note that this data is pulled into Data Studio from Google Search Console, which monitors your blog's SEO performance. You can access this data within Search Console as well, I just prefer to keep all of it in the same place in Data Studio.
# Top posts
Which posts are the most popular in a given period of time? This table tells me what my audience is most interested in, and sometimes influences what I write about.
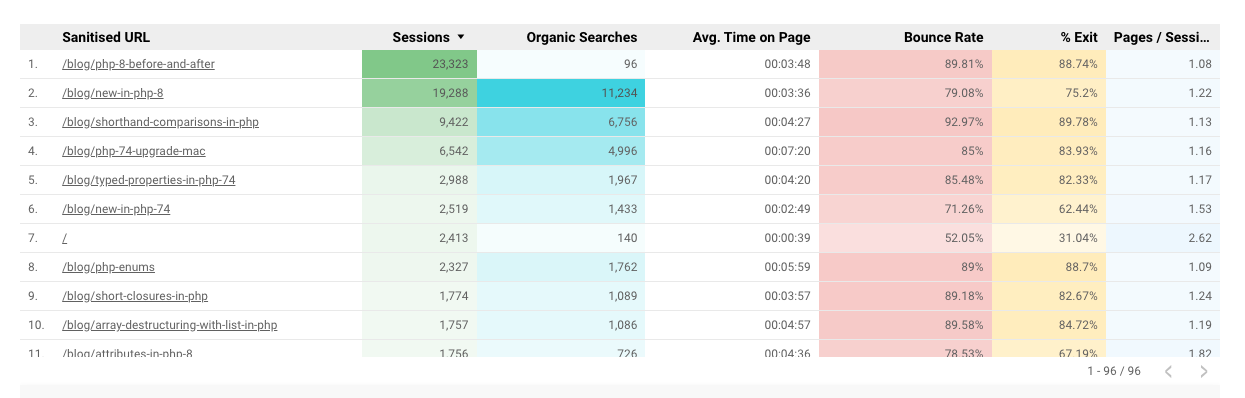 Top post analysis
I've also categorized my content into several topics, to gain insights in what my audience is generally most interested in. This doesn't mean I only write about these topics, but it's good to at least know about the topics that are most likely to be popular.
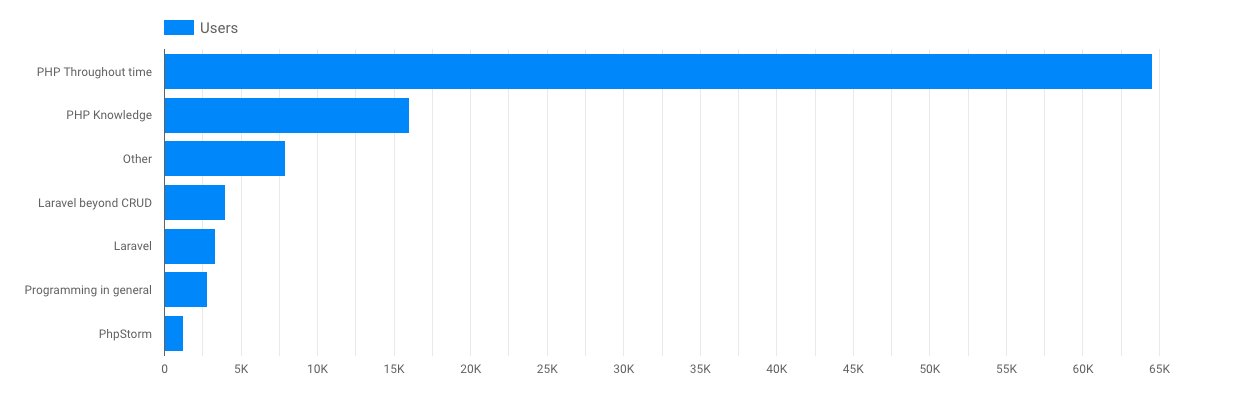 Topic analysis
# Top referrals
It's important to know where your audience is coming from. Maybe other popular blogs regularly share your content, maybe other people share your content on social media; these are places you can go to interact with a new audience and other content creators.
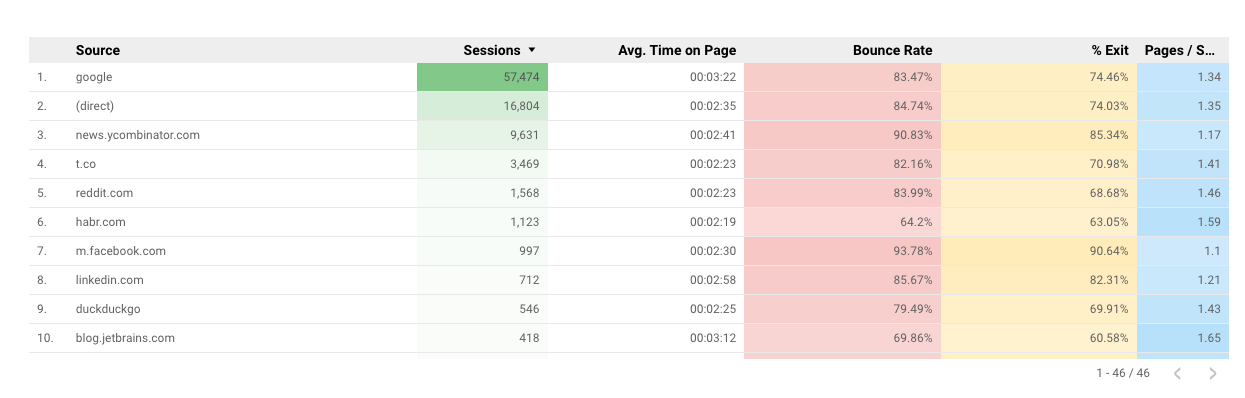 Top referrals
One interesting conclusion is that people tend to stay much longer on my blog (lower bounce rate and a higher pages/session) when they come from specific channels. Even though these channels don't result in as much traffic, they often result in a more dedicated audience. Based on this data I could, for example, reach out to the content manager of the JetBrains blog, and discuss whether there are future collaboration opportunities. It's those kinds of connections that allow you to build a dedicated audience.
# Site performance
We've already covered the importance of site performance. It's one of the few things I actually still use GA for:
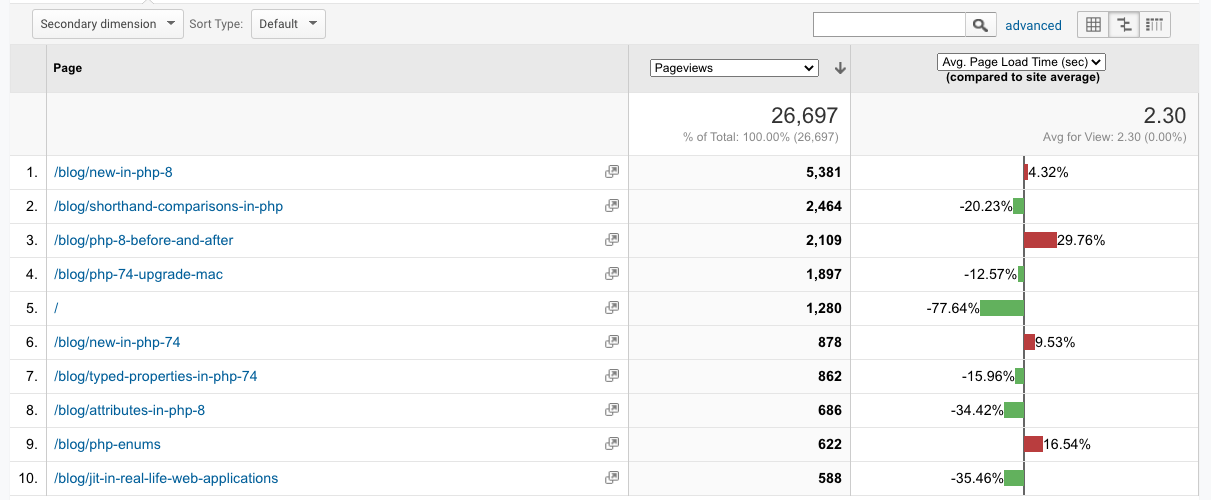 Site performance
This table can indicate whether there's a page with performance problems, and helps me to quickly fix those. There could, for example, be an unoptimized image, a third party dependency that adds unforeseen latency, etc. It's the little things like these that help your blog stay performant over the course of years.
I could tell much more about how I use data to improve my blog, but it's outside the scope of this post. I might write a follow-up post in the future, maybe answer some of your questions as well; feel free to ask them on Twitter. Also make sure to subscribe to the newsletter if you want to be kept in the loop!
In summary
- Data-driven insights are the best way to grow your blog consistently.
- Don't fool yourself with charts, know how to interpret data correctly.
- Try to answer specific questions with data: which of my posts are the most popular? Is my blog growing? Who else is referring to my blog?
- Start simple, and grow your analytical platform over time.
Index
Do you enjoy this series?
I write about much more technical and blog related topics, if you want to you can subscribe to stay up to date about my content.
You can also subscribe via RSS.
Available now: my book "Things I wish I knew when I started programming". You can buy paperback or ebook versions today!