Analytics for developers
Written on 2019-01-22I've been running this blog for almost three years now. I've used Google Analytics, not only to track the amount of users, but also to actively improve my blog.
I'm no marketeer, just a simple developer. Today I want to share from my technical experience, how I use traffic data and react to it.
Filtering data
First and foremost, the boring part. It takes less than five minutes to set up, but will improve the correctness of your data: filters.
As you know, Google Analytics works with a tracking code which you can place everywhere. That tracking code can easily be used somewhere else, polluting your data. I'm thinking of local development environments or, more malicious: people who steal your tracking code as a deliberate attack.
Luckily this can easily be prevented with filters. So take five minutes to set up some filters in the admin section:
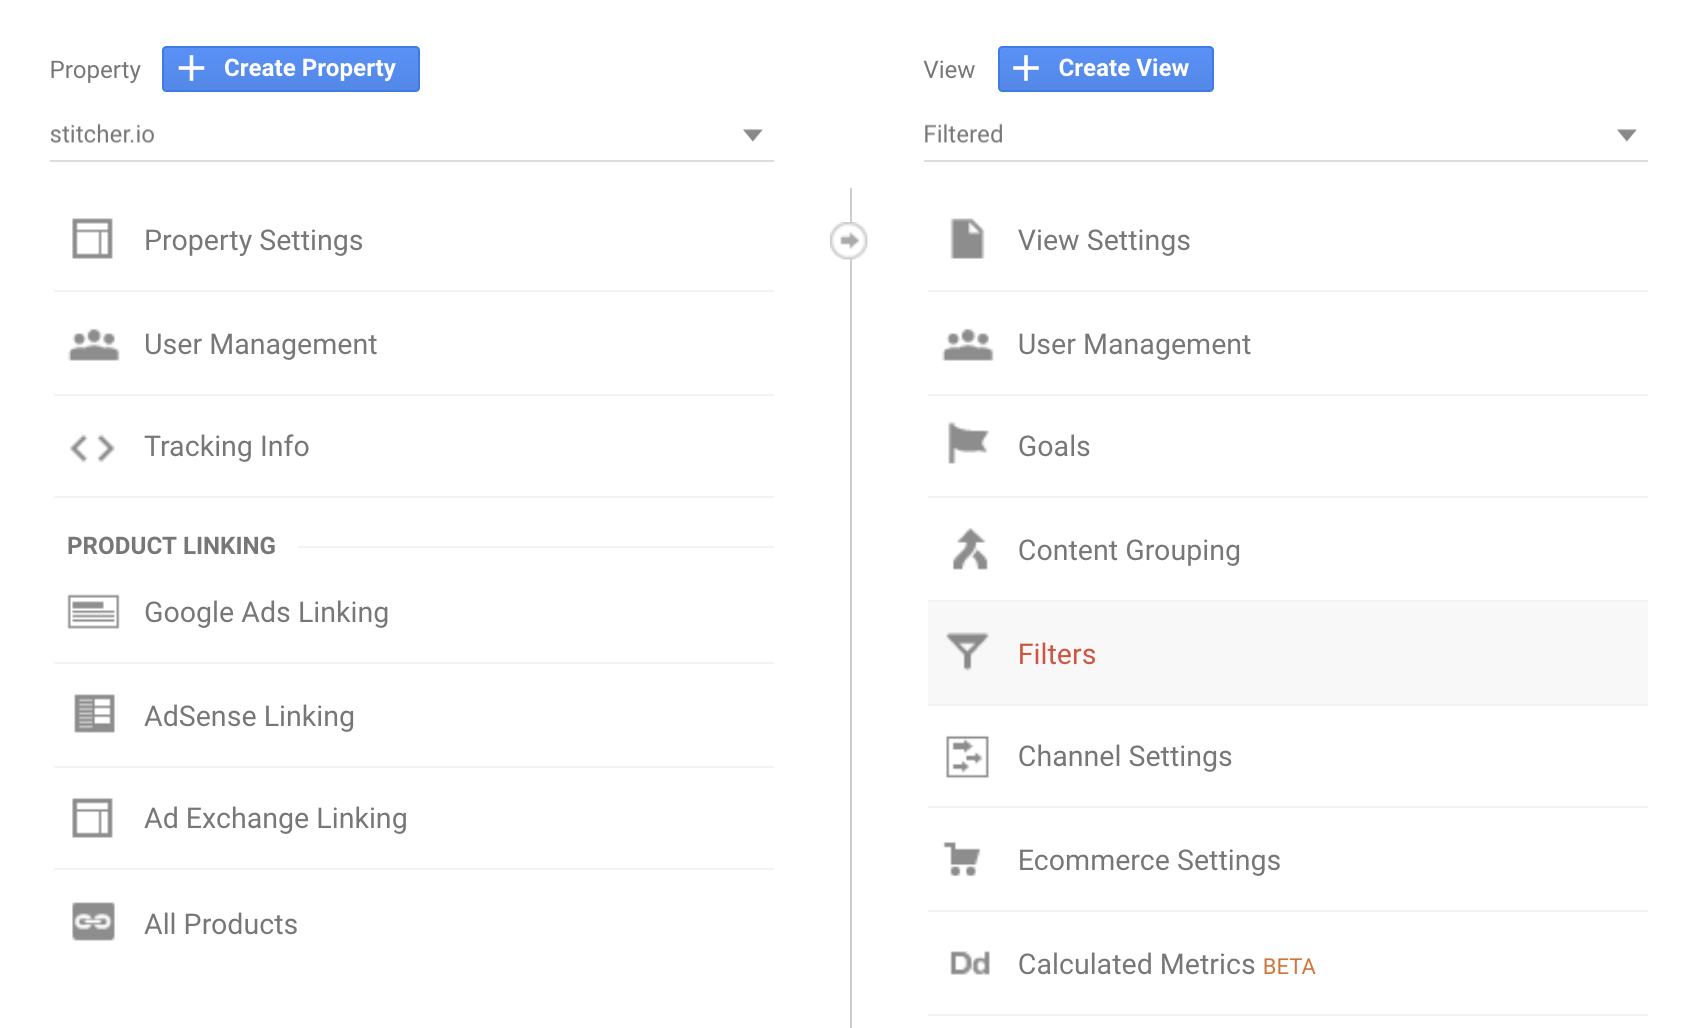
With filters, you can build a whitelist of traffic you want to include. I usually make a separate view called "Filtered", and keep the "All Web Site Data" view as is, for testing.
Here's an example of a filter I set up, to only include traffic from the "stitcher.io" domain:
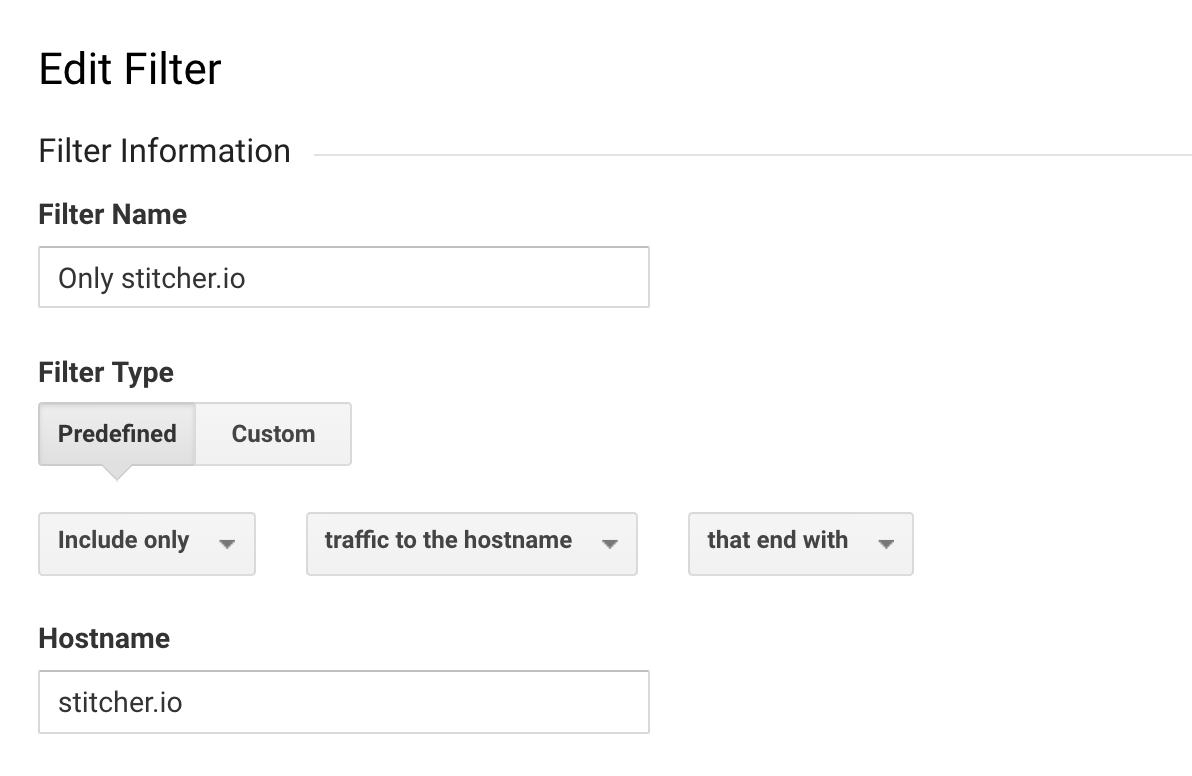
You can also filter out local domains, whitelist IP addresses and more. If you want to be really safe, you could whitelist the IP address of your host, in combination with the host name.
With the correct filters set up, it's time to interpret data.
Decreasing bounce rate
Here's a good question to start with: "should I want to decrease my bounce rate"? The corporate marketeer will of course scream "YES".
I say: it depends. Take for example this blog, or almost any other blog. When I share a post on social media, most visitors come to read that post, and that post only.
It's not that weird when you think about it: don't we all do the same when browsing?
A high bounce rate means that not a lot of visitors click through after their first page visit. In case of a blog, there's nothing wrong with that: many of these people will return the next time you share a link on social media.
Let's take a look at the traffic in November of 2018, on this blog.
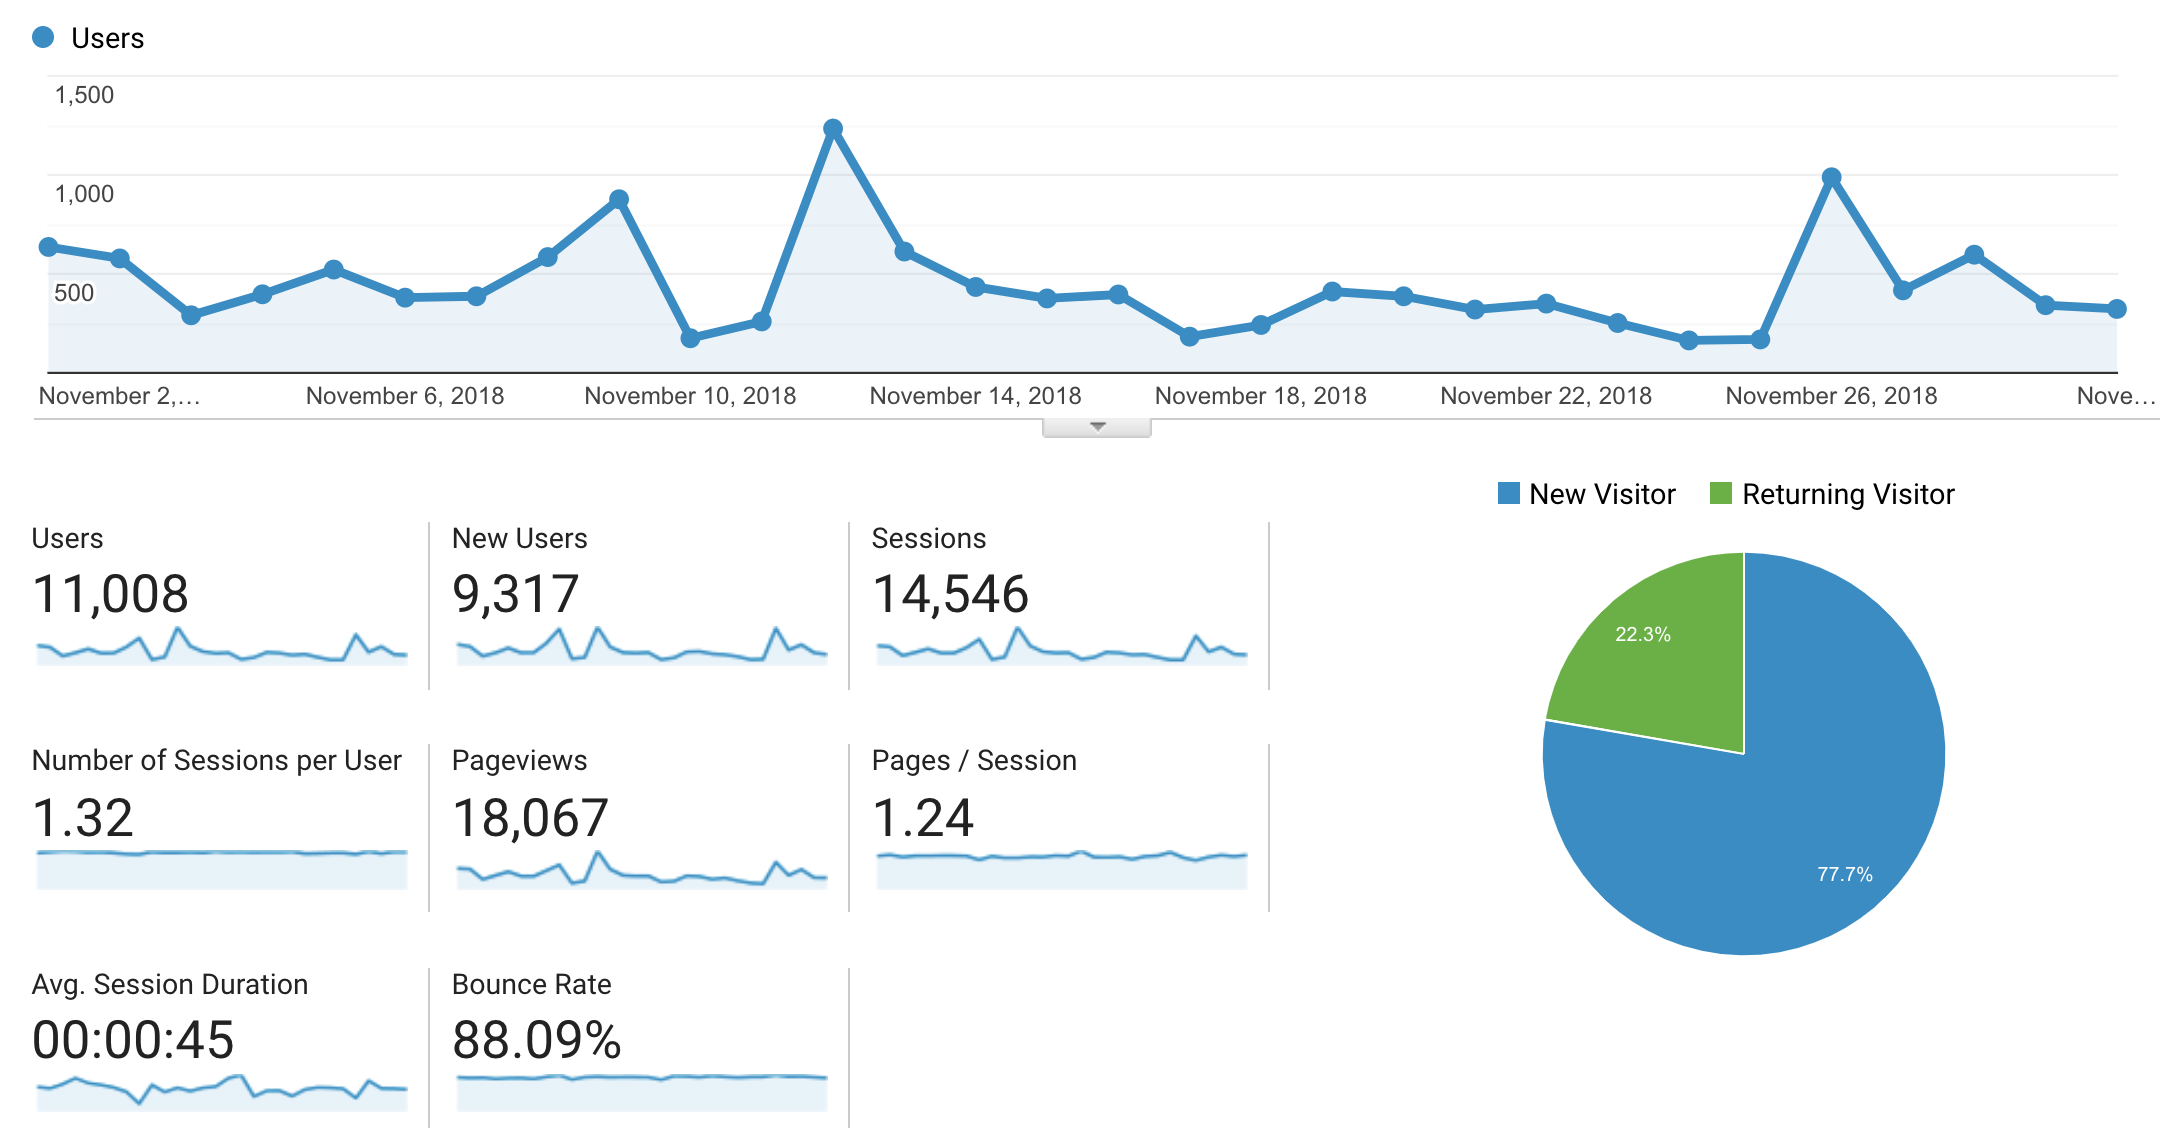
That's a rather high bounce rate. Though over the last year, I see a consistent 20-ish percent of returning visitors. These people also add to the bounce rate, though they are the ones who visit this site over and over again, albeit only one page at a time.
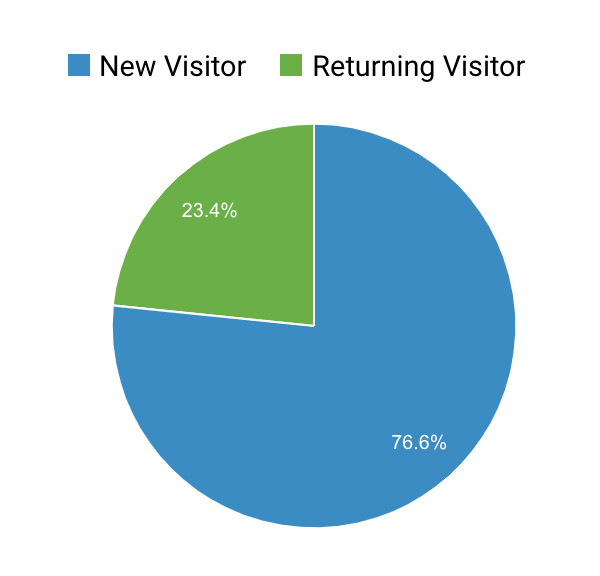
You can see how relative this data is, and how you cannot simply say "decrease the bounce rate".
But what can we learn from it though?
If you're a regular reader of my blog, first of all: thanks, you're in the 20% ! Secondly: you know that I place an "up next" link down at the bottom of each post.
In the past, these links were automatically generated and just showed the post before the current one.
When analysing the bounce rate of individual pages though, I noticed that some pages had a way lower bounce rate than others.
Looking at these low bounce pages, they were the pages where I deliberately put another link at the bottom, one to a post of which I thought was a little related to the current one.
So how do you analyse this?
The "Content Drilldown" page is great to analyse per-page statistics.
You can find it under Behavior > Site Content.
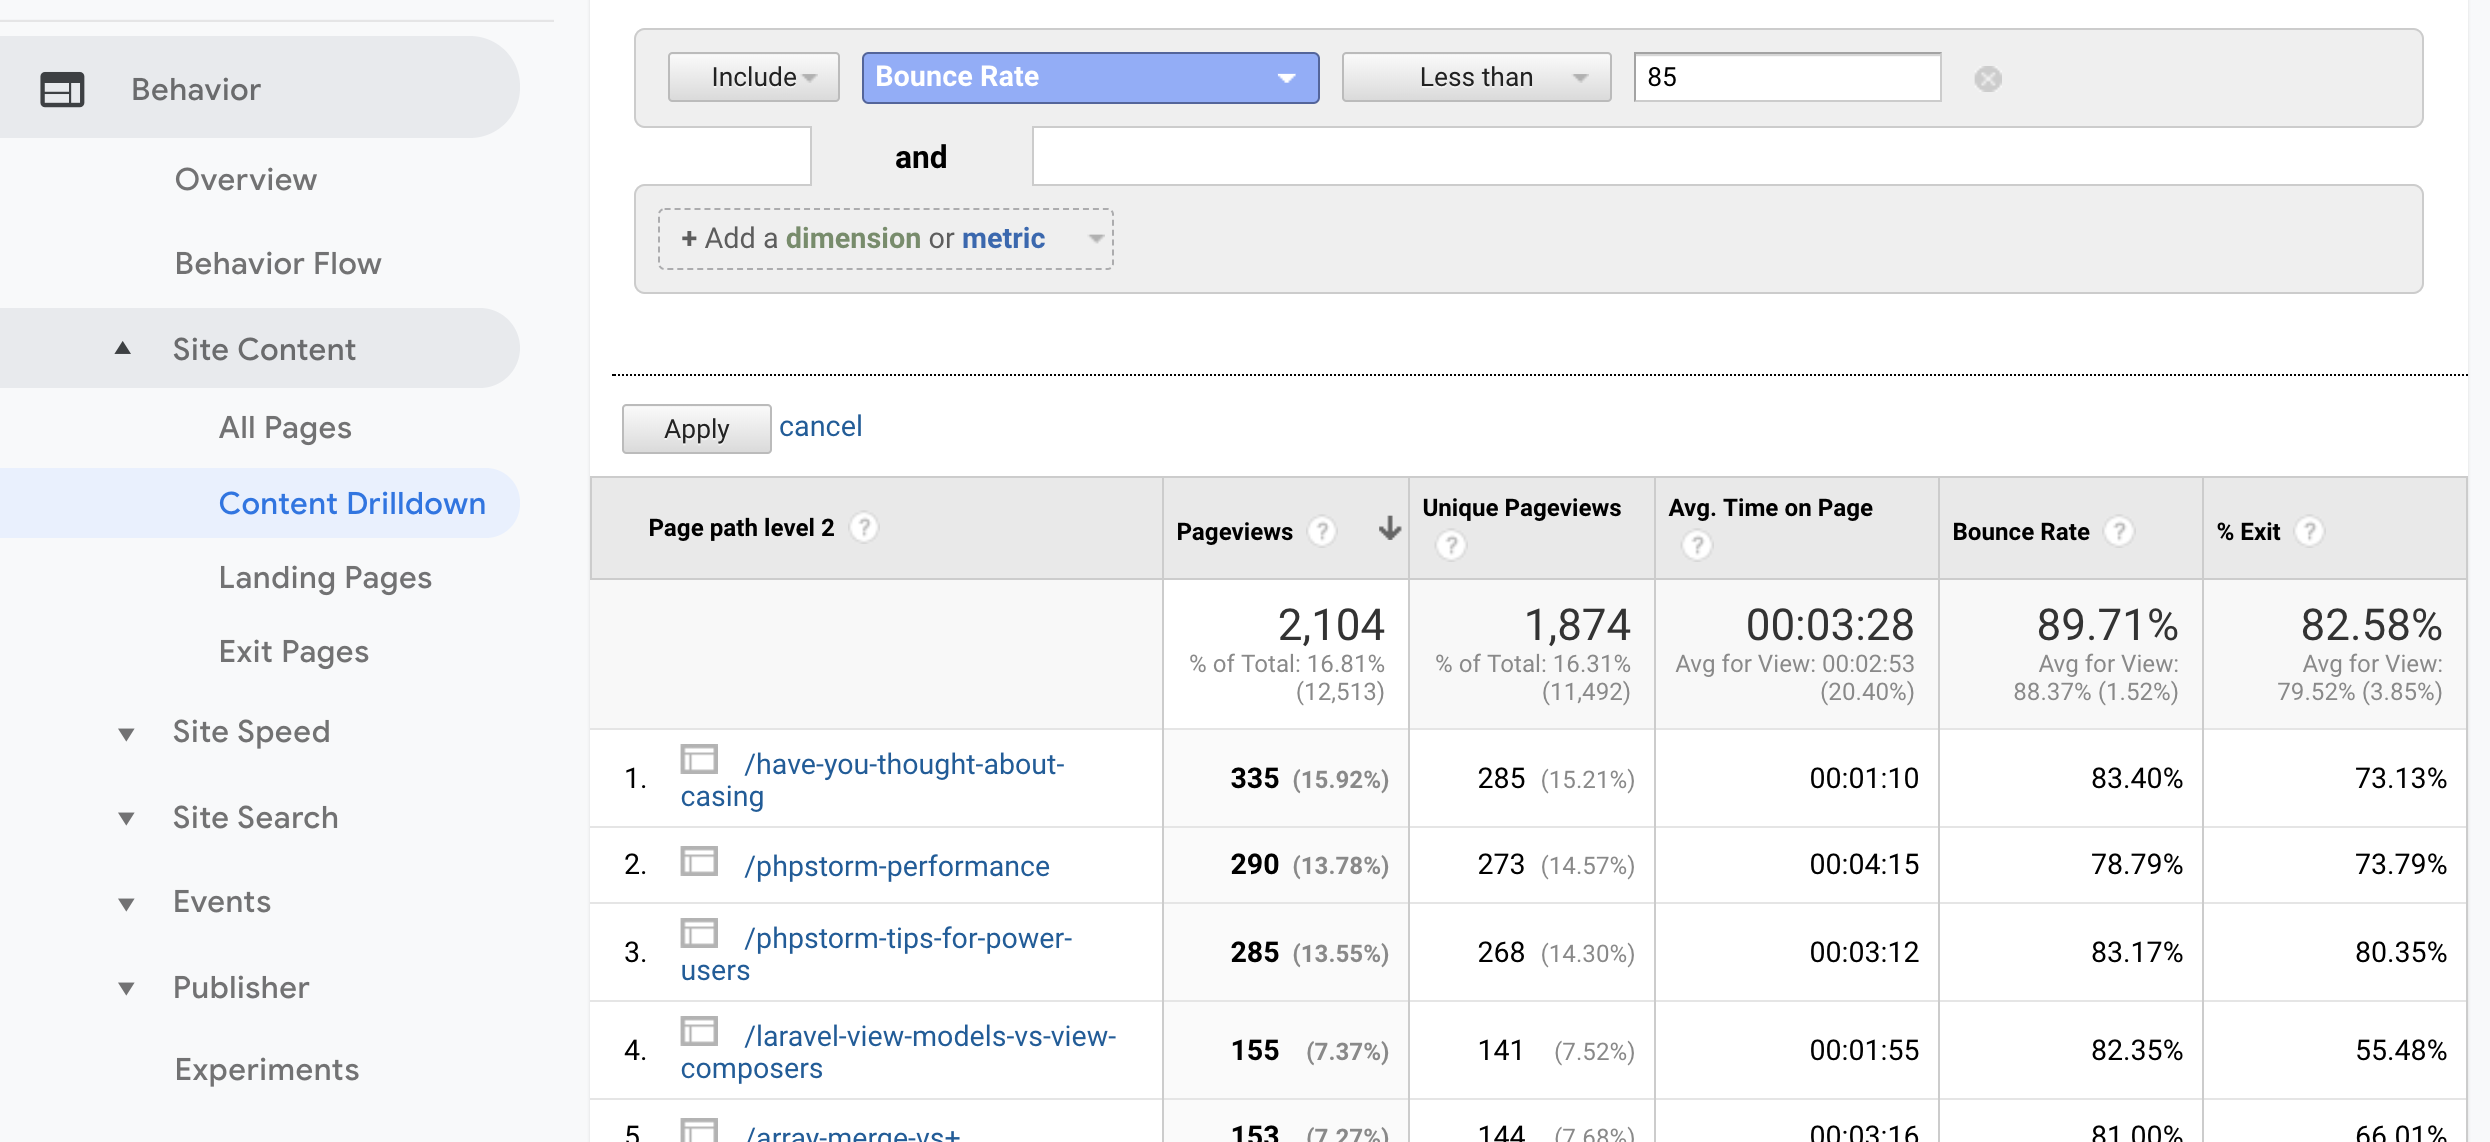
Also note how the "advanced filter" is applied to only show pages with lower bounce rates. We can use this data to learn what we're doing right, and target pages that might need optimisation.
Top referrals
I know most of my traffic comes from links that are shared. I've got some posts that show up high in Google, but more about that later.
The "Referrals" page under Acquisition > All Traffic is an important one to know where your traffic is coming from.
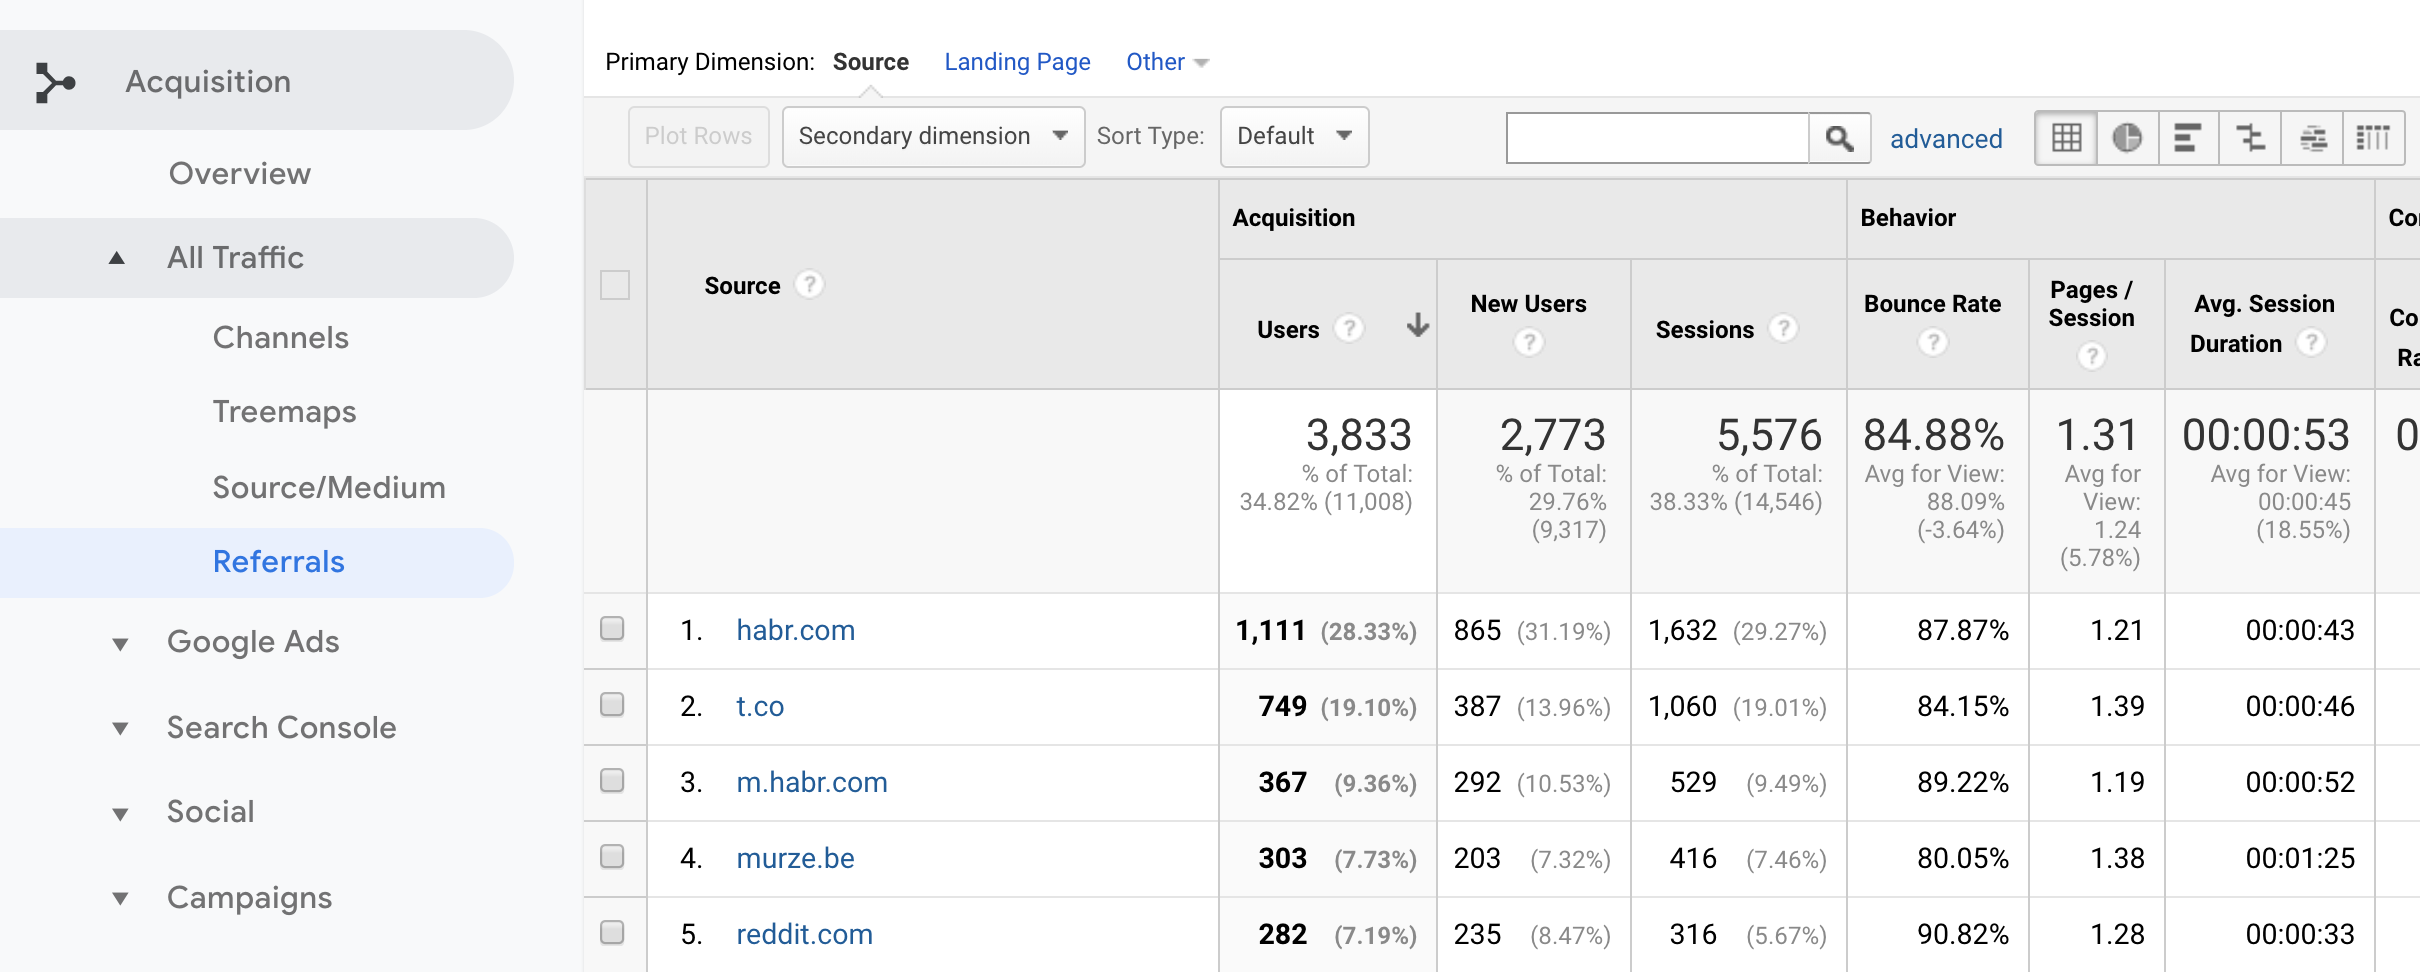
You can see peaks in traffic during the day, by using the real time overview. I often check the referrals at these moments, to know where traffic is coming from.
I believe that, as an author, it's important to engage with your readers. When content is shared on social media, reactions often show up there; so it's only natural that you reply to them there.
A quick Google search on the blog title and website of the referral, often gets me to the right place in no time.
Average session duration
Now that we know people are visiting our blog, we also want to know whether they are actually reading the content.
Again, the "Content Drilldown" page gets us this data.
By adding a simple regex filter ^\/[a-z\-]+$, we filter out pages with query parameters.
We're also not interested in pages with very low pageviews.
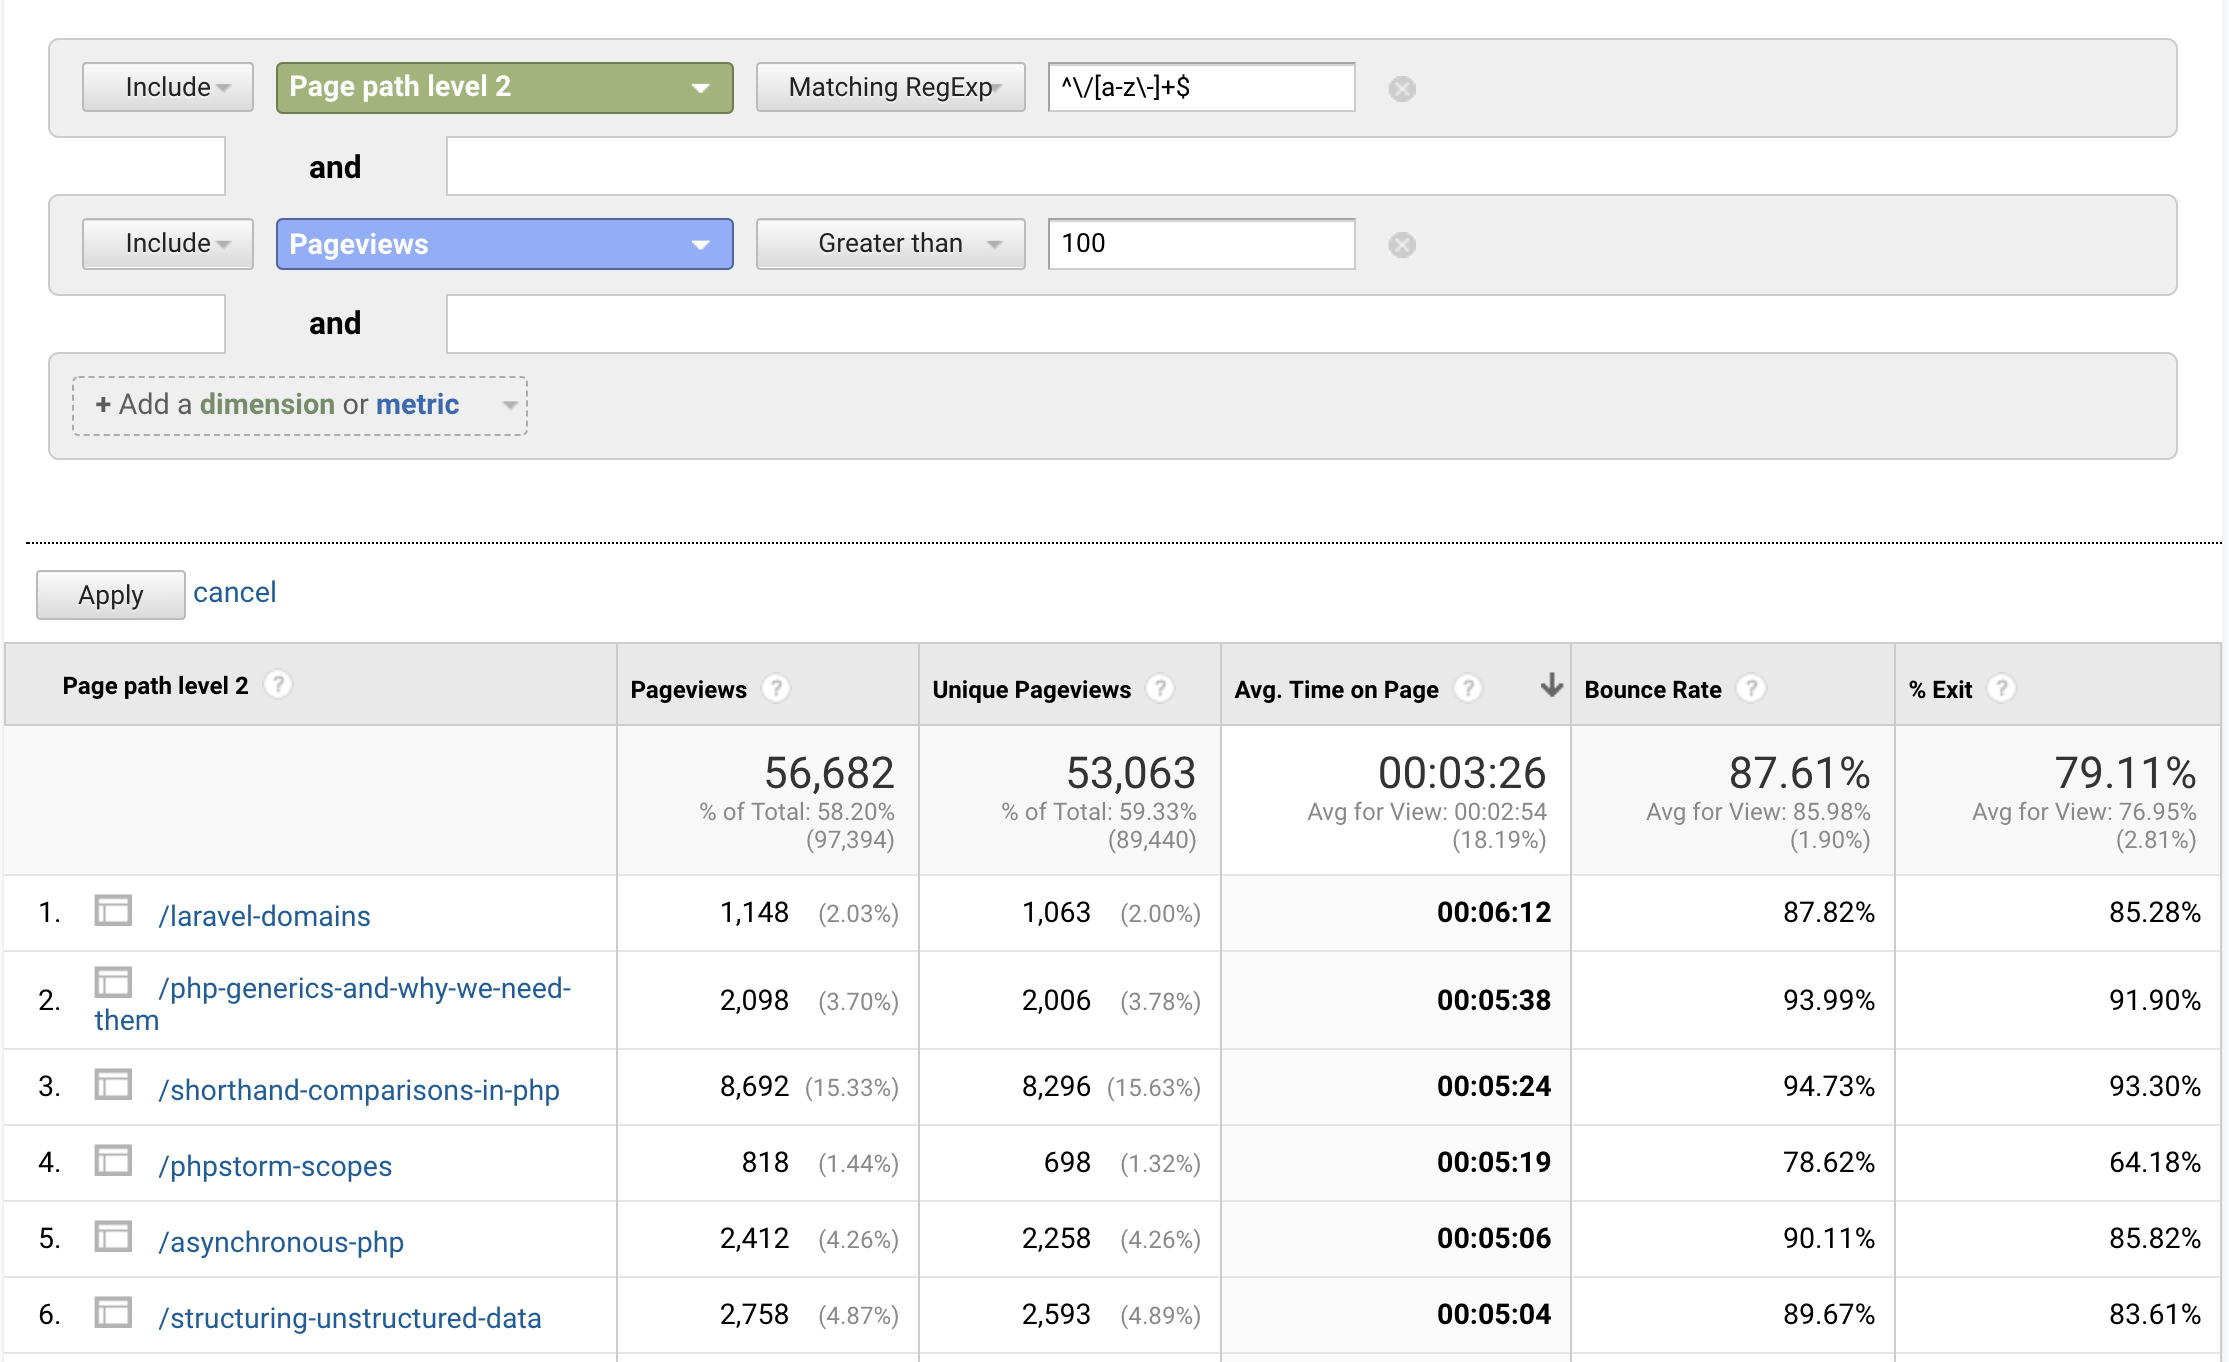
What we're actually interested in, are the pages with the lowest session duration, to see whether some things can be improved.
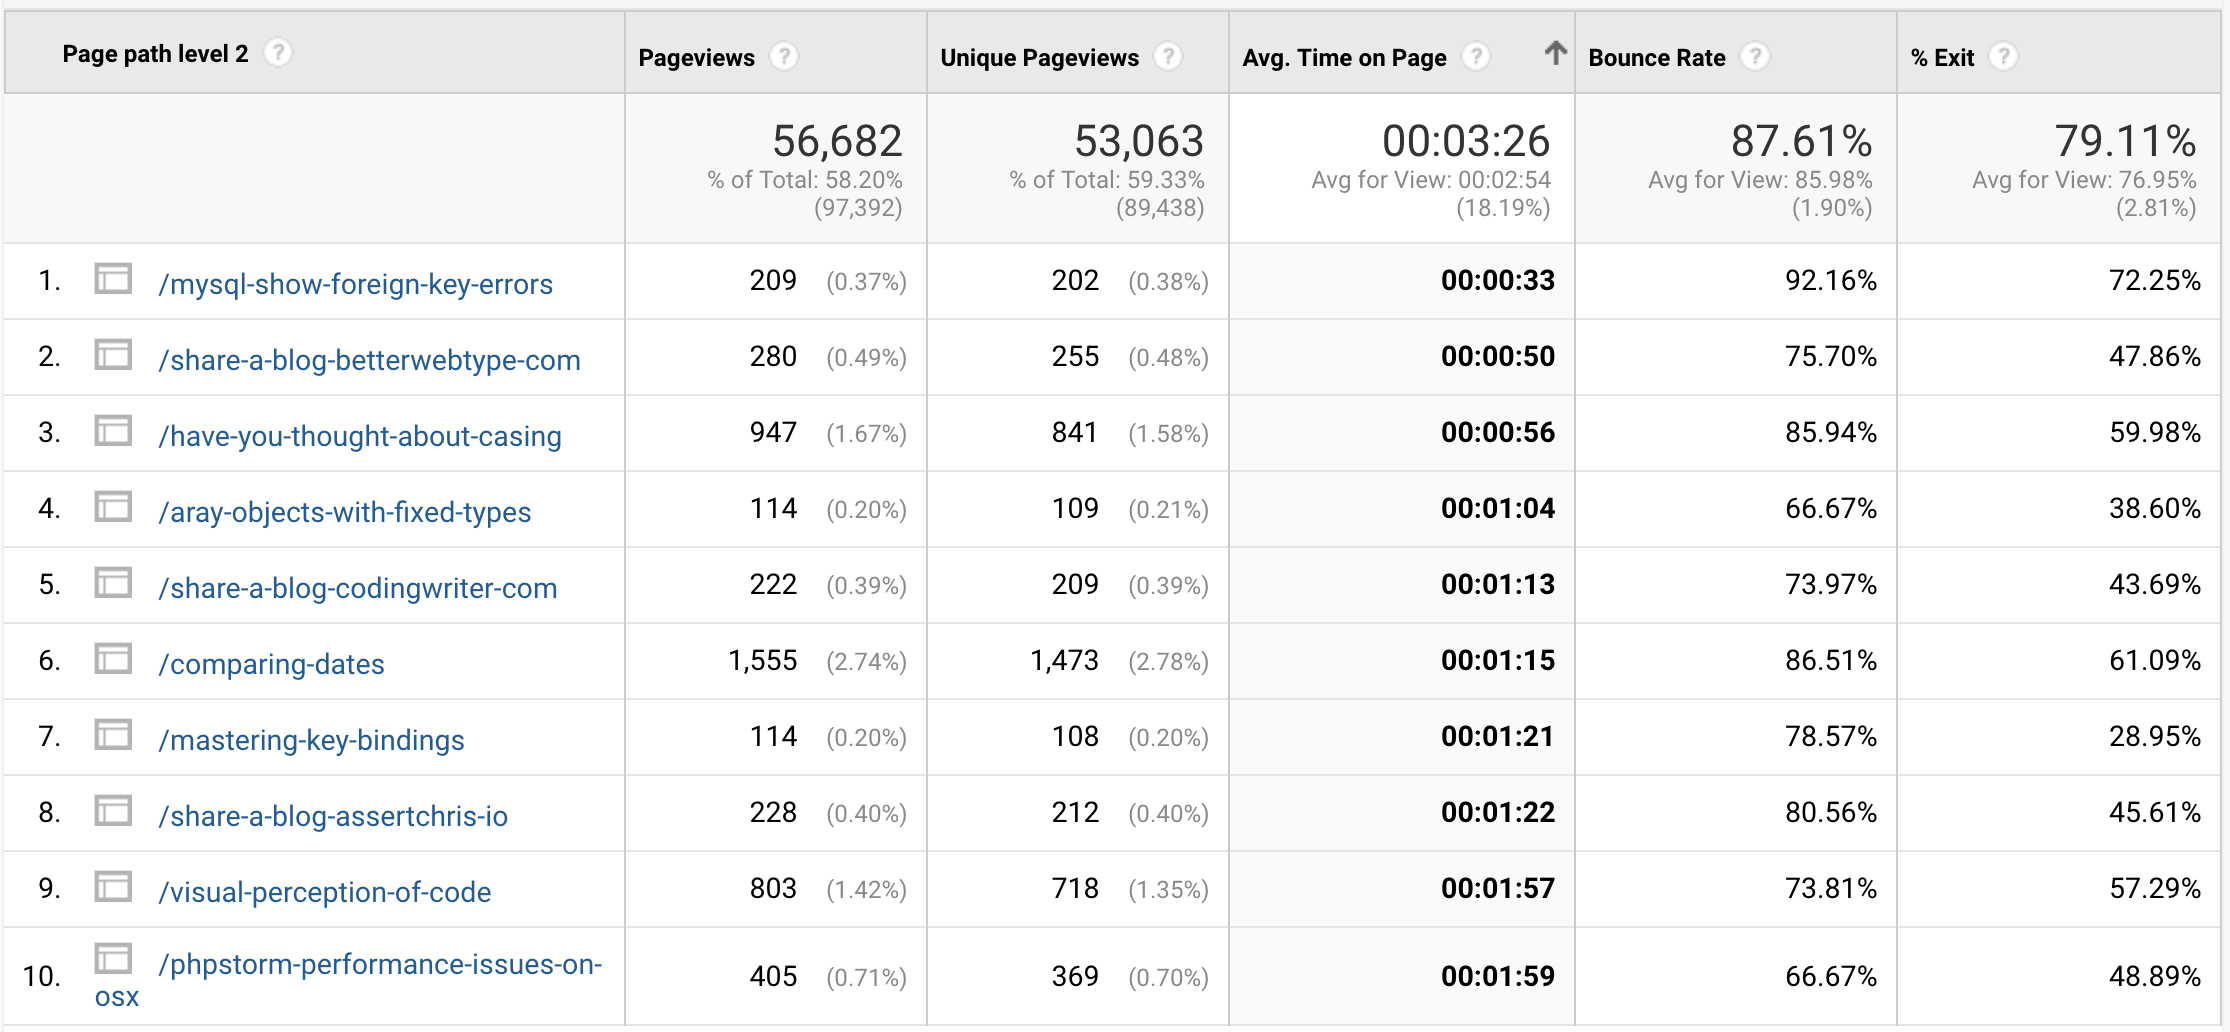
Some of these blog posts are very short ones, so nothing strange there. Though it also shows what posts were less interesting to my audience. It's a good metric to know what kind of content I shouldn't focus on.
Analysing behaviour flow
The "Behavior Flow" chart under the Behavior menu is one
that helps visualising how visitors browse your site.
This is what it looks like.
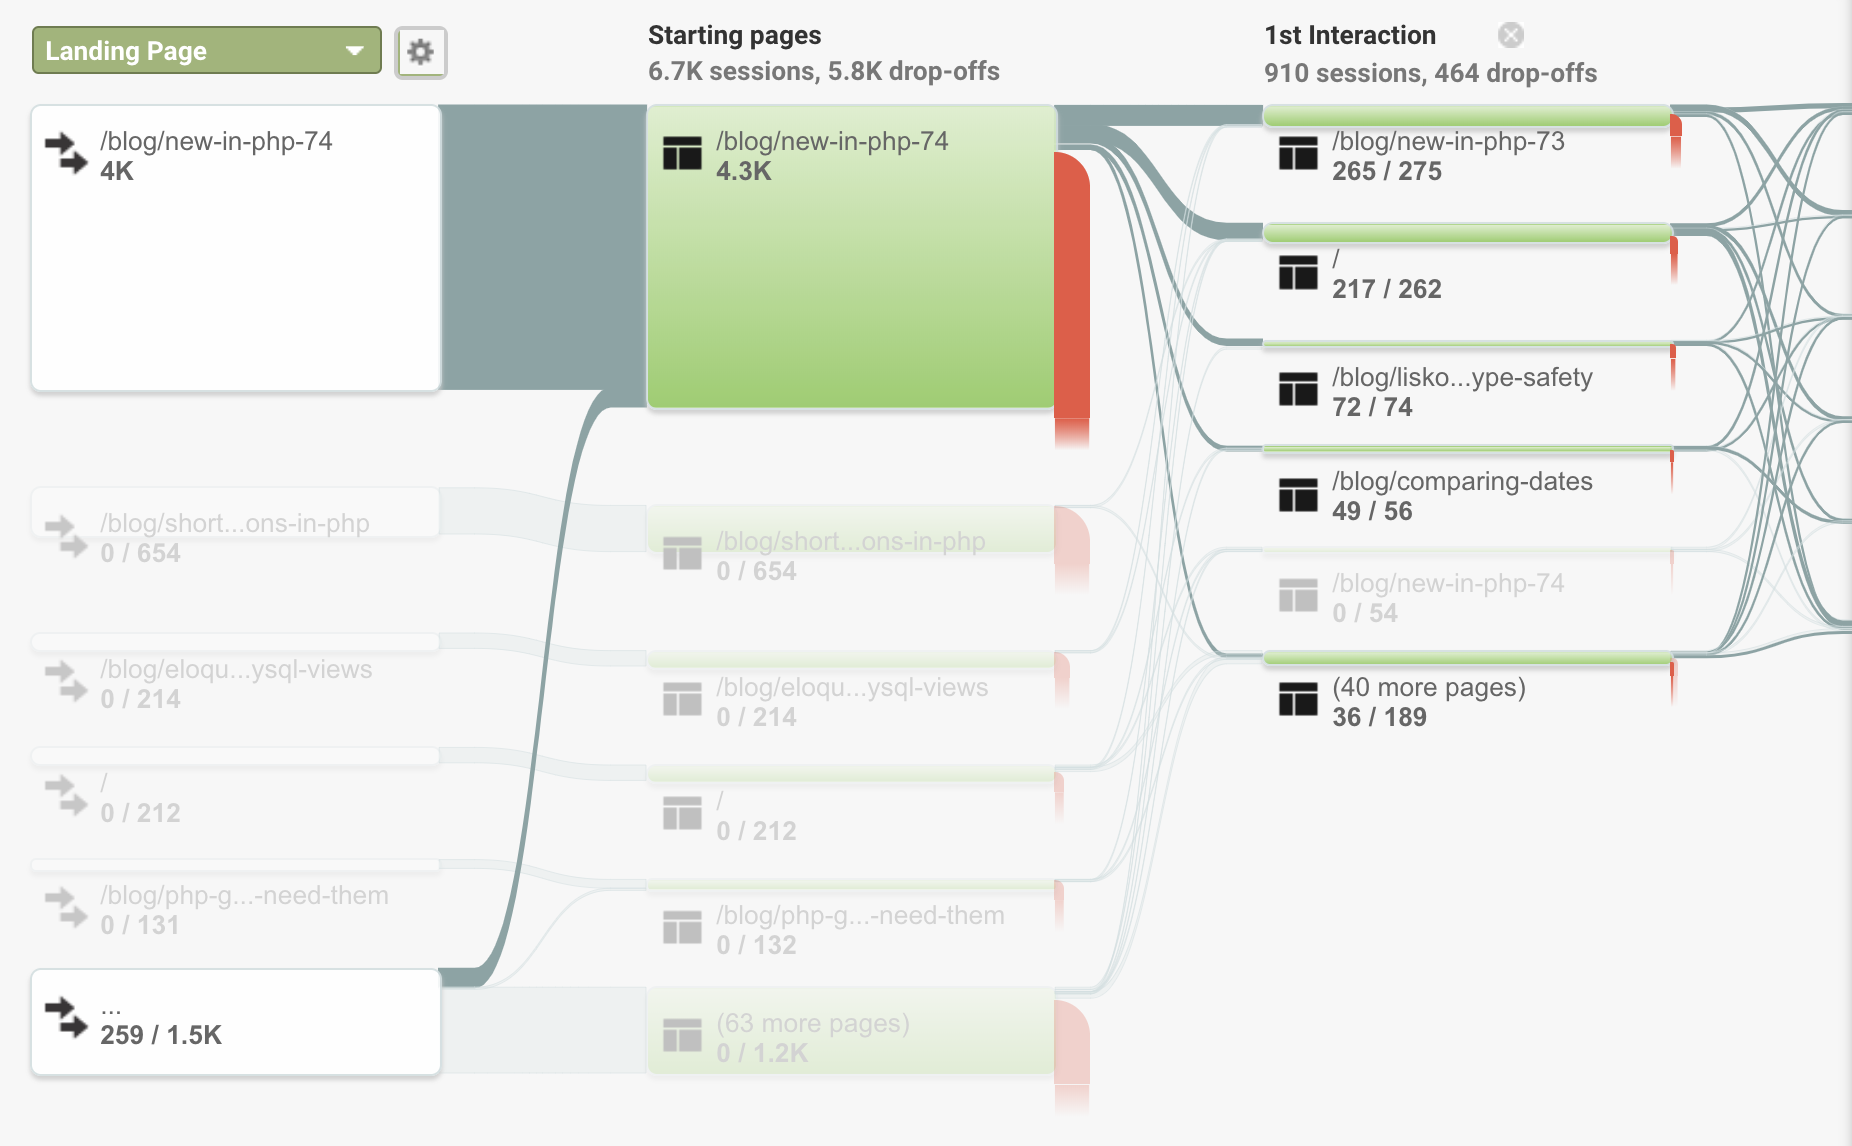
As with the bounce rate optimisations, this overview can help identifying pages that encourage people to click through, and pages that don't.
I use this overview in combination with the "Content Drilldown" page, to analyse where people come from, where they go, and whether I can improve my content to help them read what they are actually interested in.
Analysing keywords and search
I know that most of my traffic comes from links that are shared over the internet, though I also want to know how much comes through search sites like Google. These pages get a more constant amount of monthly visitors, and might pose a good opportunity to introduce readers to my blog.
By going to Acquisition > All Traffic > Channels,
you can click through to the "Organic Search" channel.
By default, this overview shows what keywords were searched on, which isn't very useful to us right now. You'll also notice that most of the time, this keyword data is simply missing.
You can however specify a "Secondary Dimension", on the "Landing Page". Now the overview will be grouped per page the visitor landed on, which is exactly what we want to know!
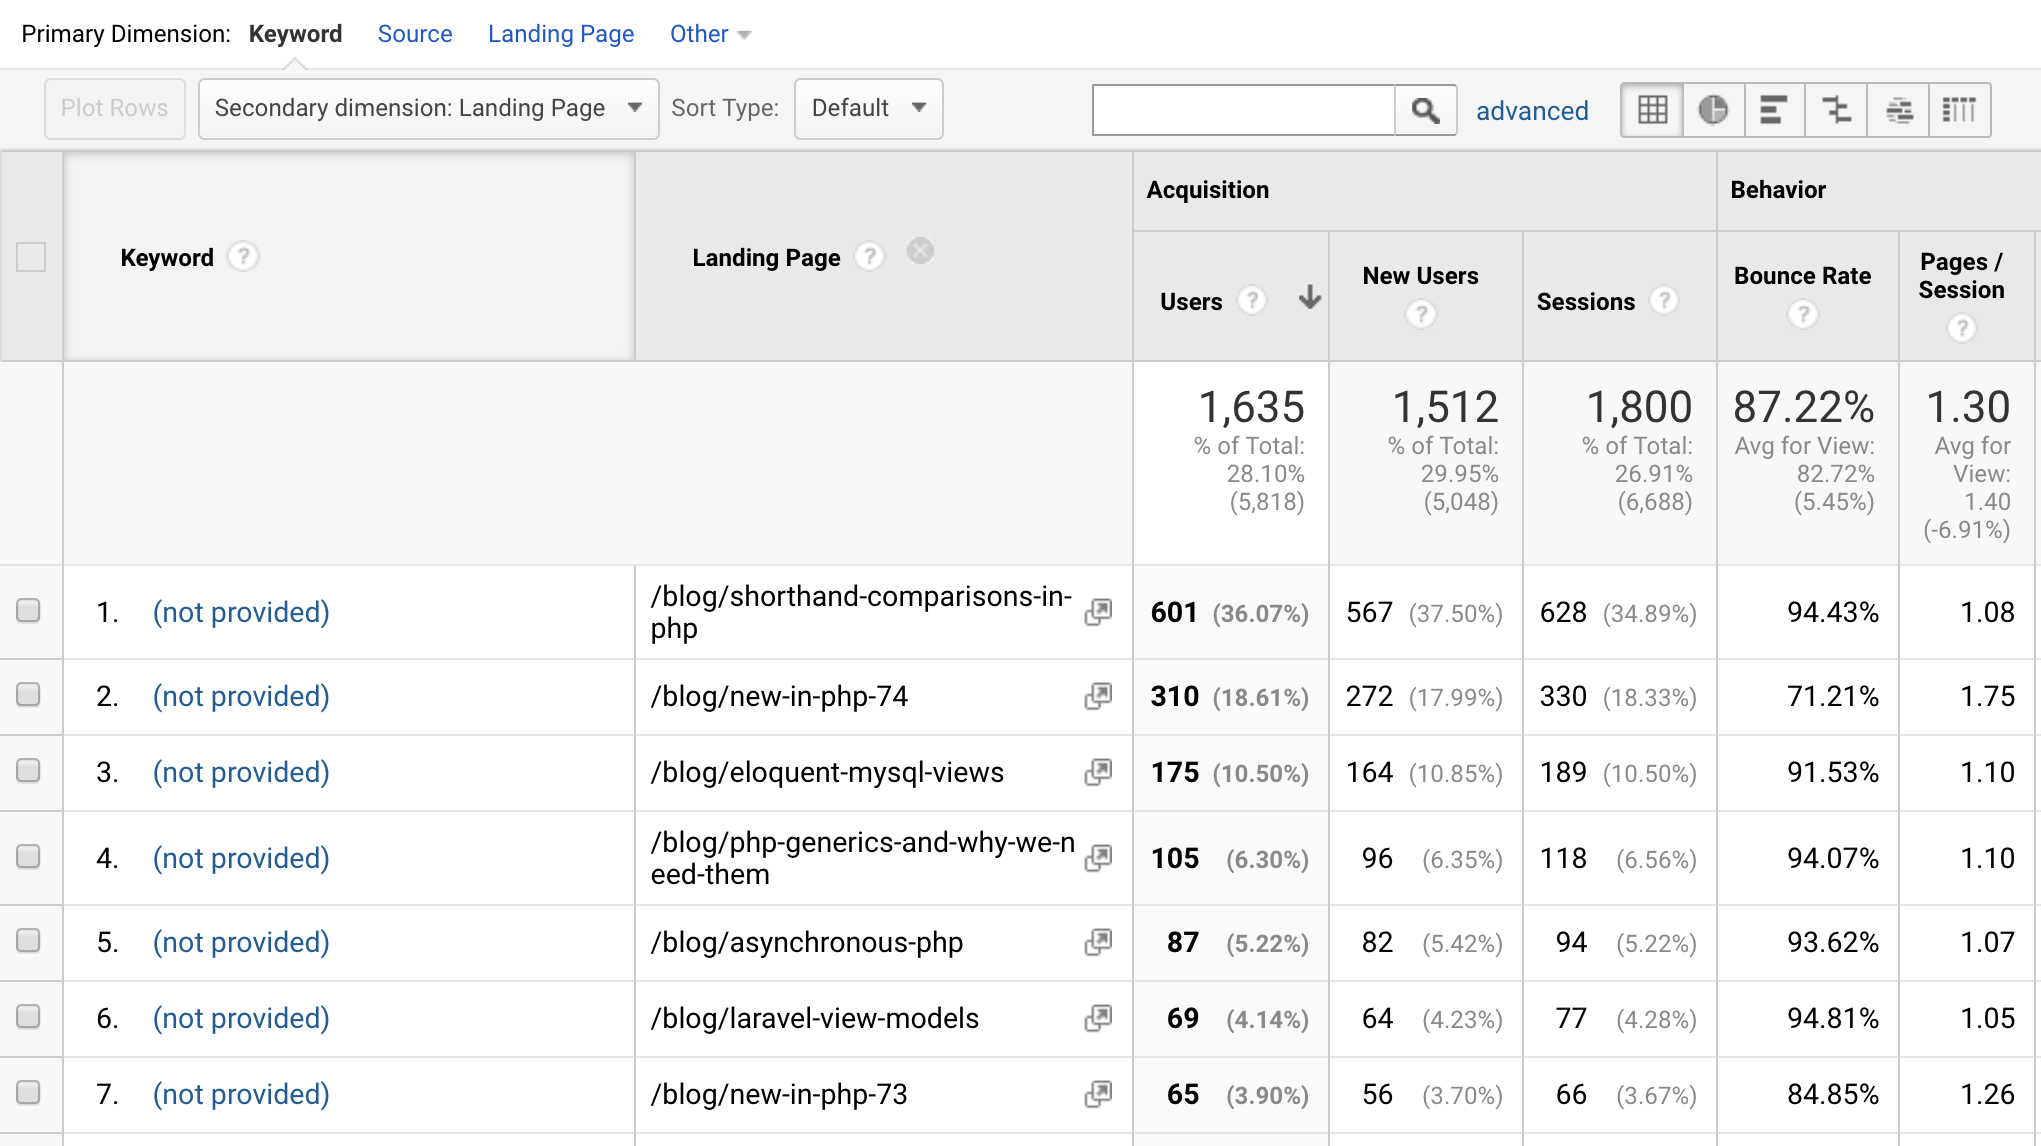
Now we know what pages are good candidates to optimise, but we still don't know what keywords people actually searched for.
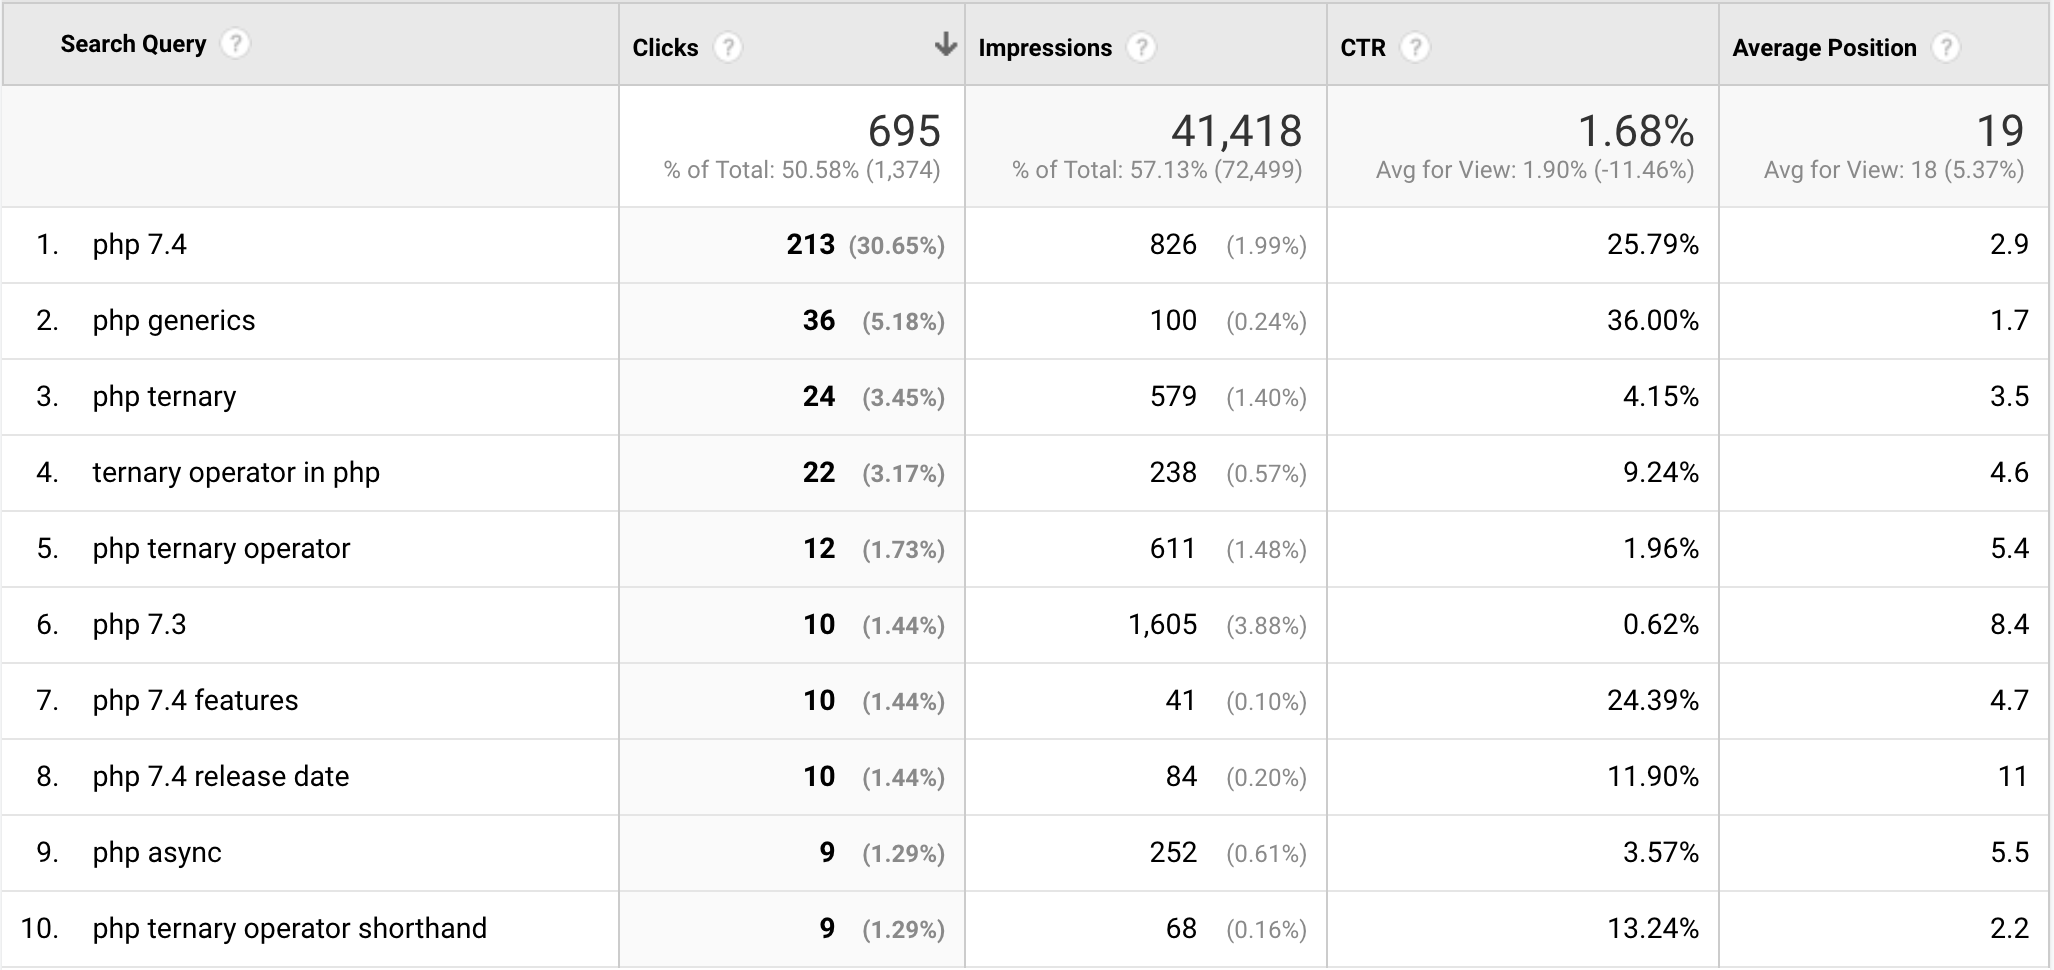
If you link your Search Console to Analytics, you'll get the data you need.
On Acquisition > Search Console > Queries, you'll see an overview of these keywords.
Here's an example, for this past week in January, 2019:
Measuring site speed
Lastly, something I'm very proud of: my blog's performance. When building this blog I really wanted it to be fast, everywhere.
Analytics also helps with that. Under Behavior > Site Speed > Page Timings,
you can monitor the performance of individual pages.
Take, for example, the most visited pages of November, 2018.
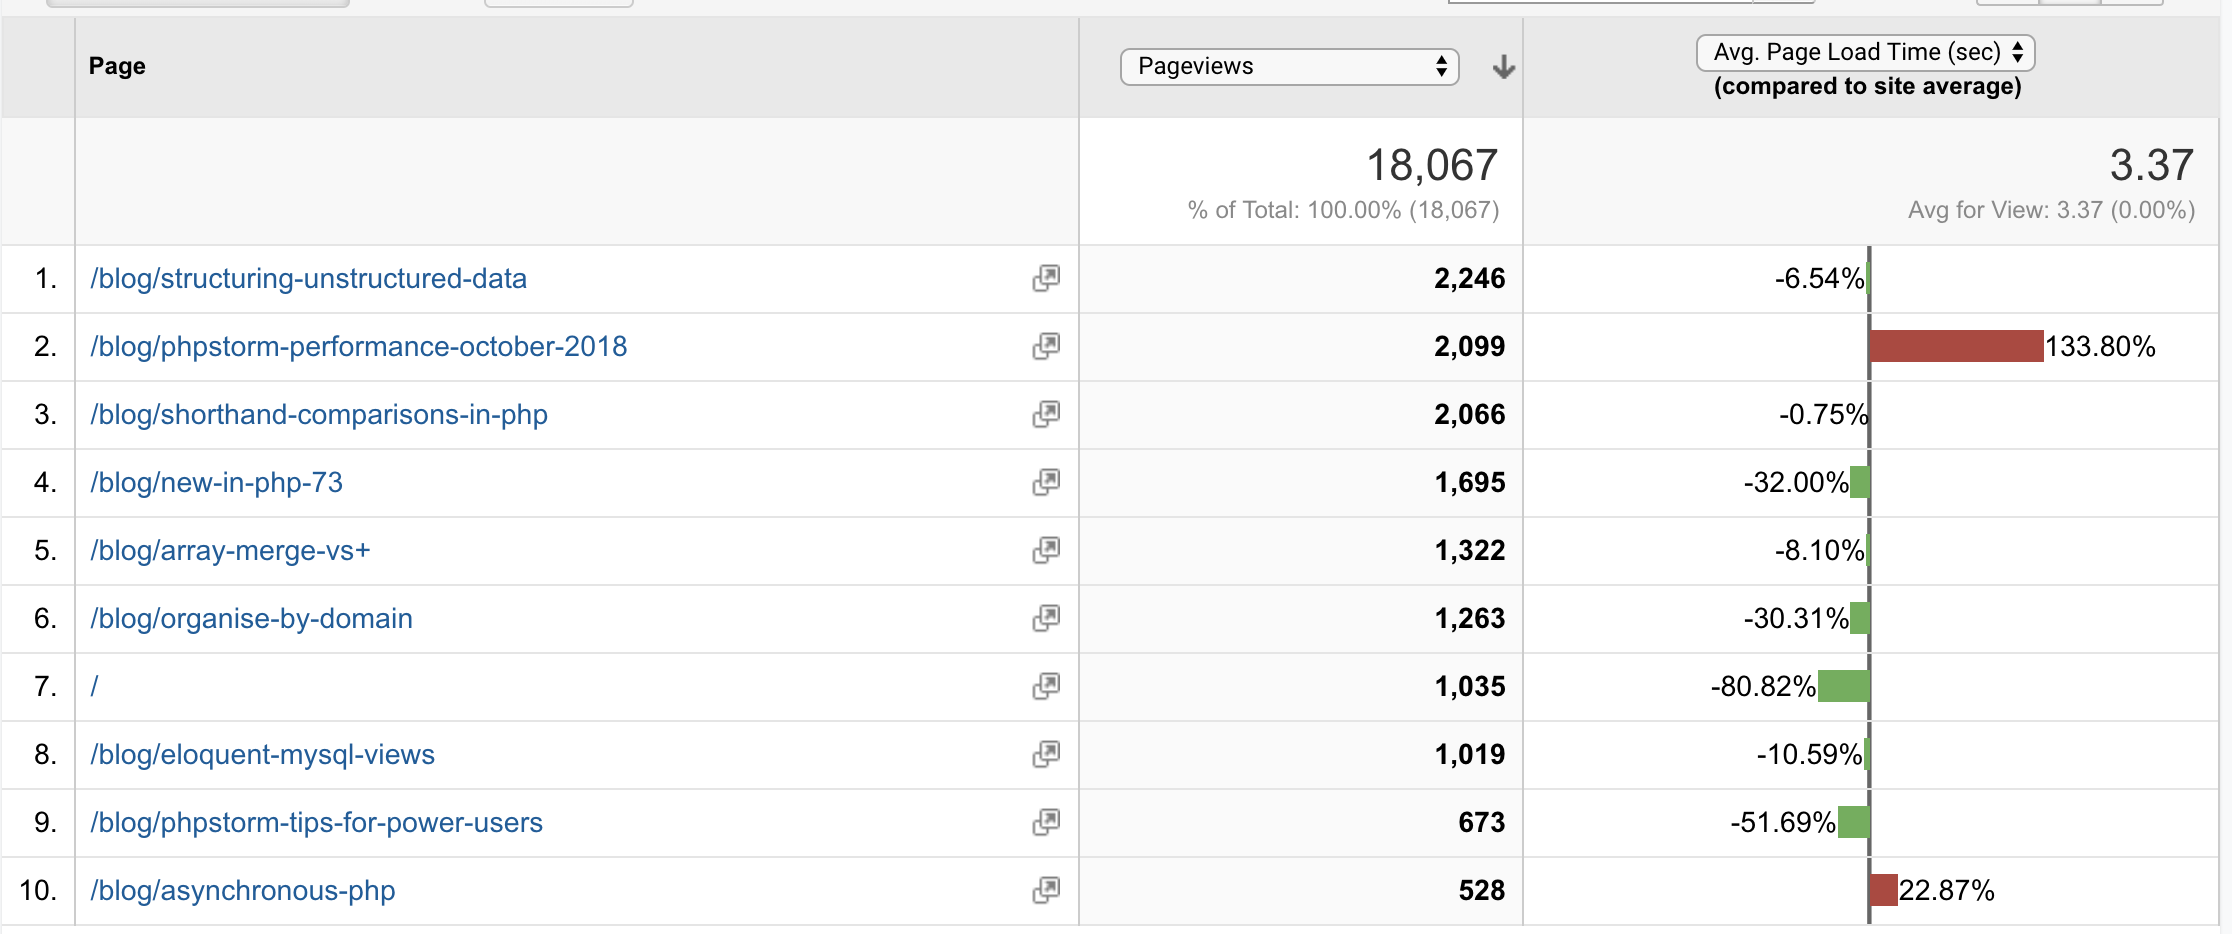
The red lines are the interesting ones: these pages load slower than the site's average. This can be because of many reasons: lots of visitors with a bad connection to the host, images that should be better optimised, maybe a problem with a script I wrote for a post?
This view allows me to find performance problems early on, and fix them.
In closing
This was of course nothing close to all the features Analytics offers. But I hope that I did show you the mindset I have when analysing data. These are real people visiting my site, and I want to do good for my audience.
Google Analytics is a great tool to help you with that, but in the end, it all starts with good content.